Part 1: Beautifully folded. Fundamentally limited.
Why a paper map is just a glorified souvenir
We’ve spent centuries making printed maps better at representing places, but far less time asking whether representing them is enough.
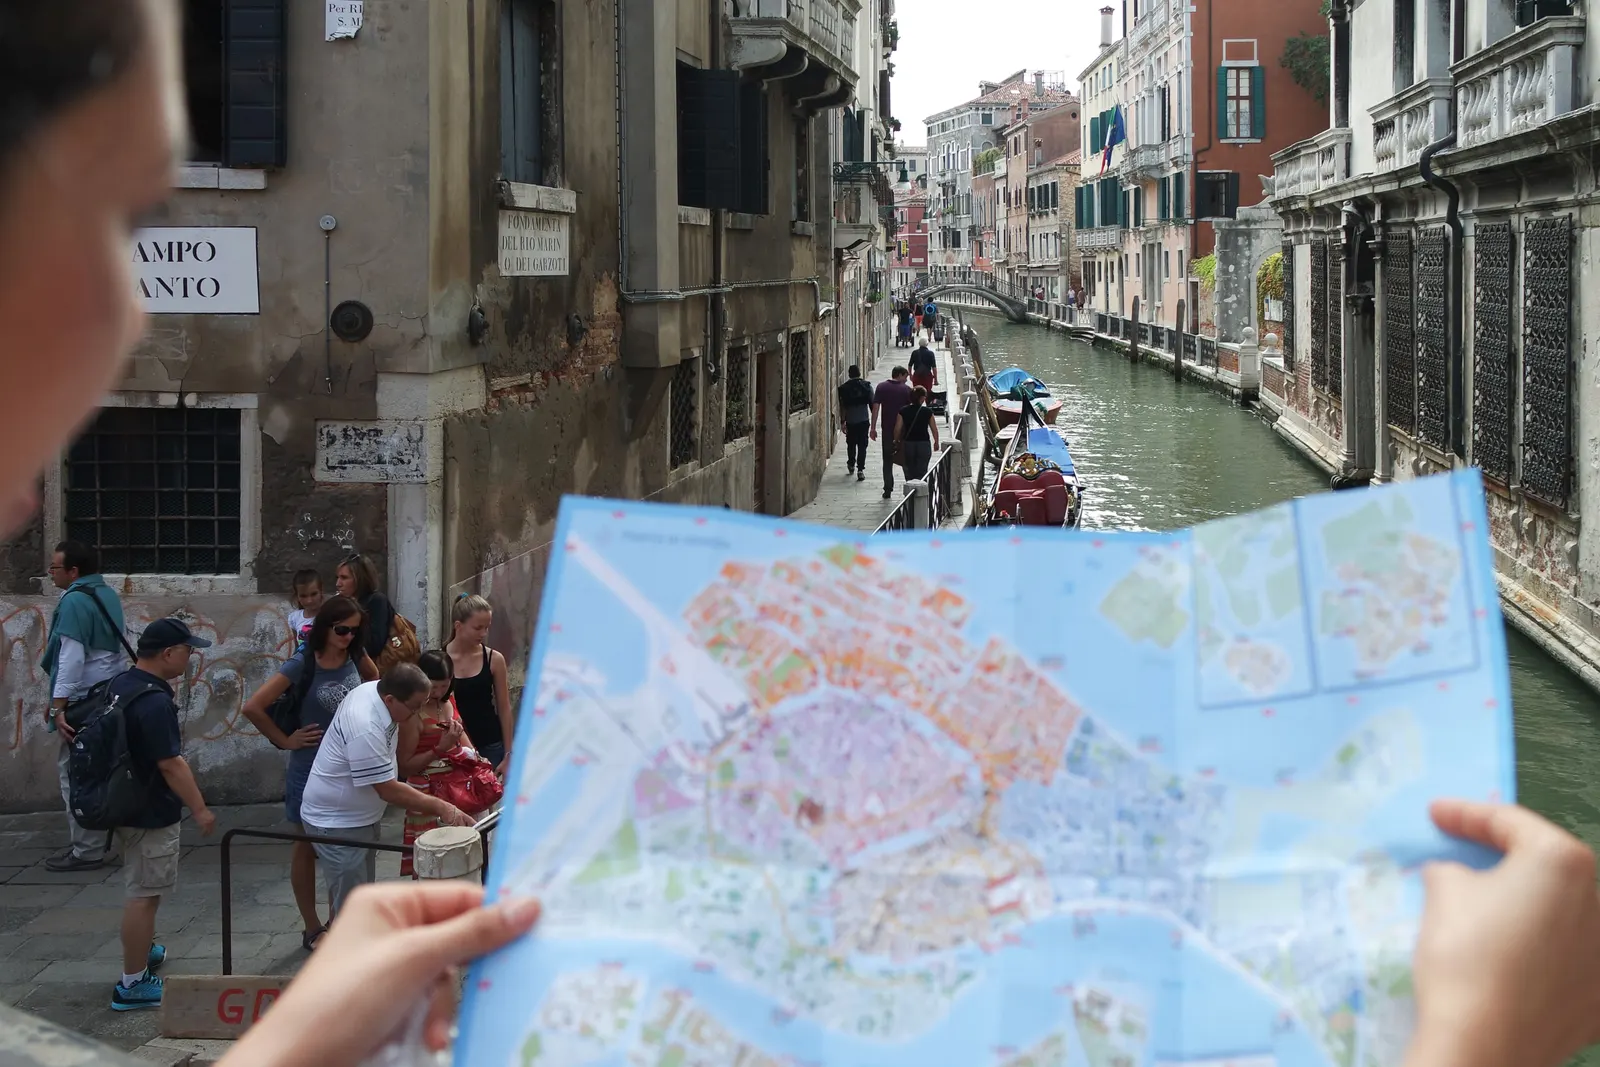
We all know the ritual.
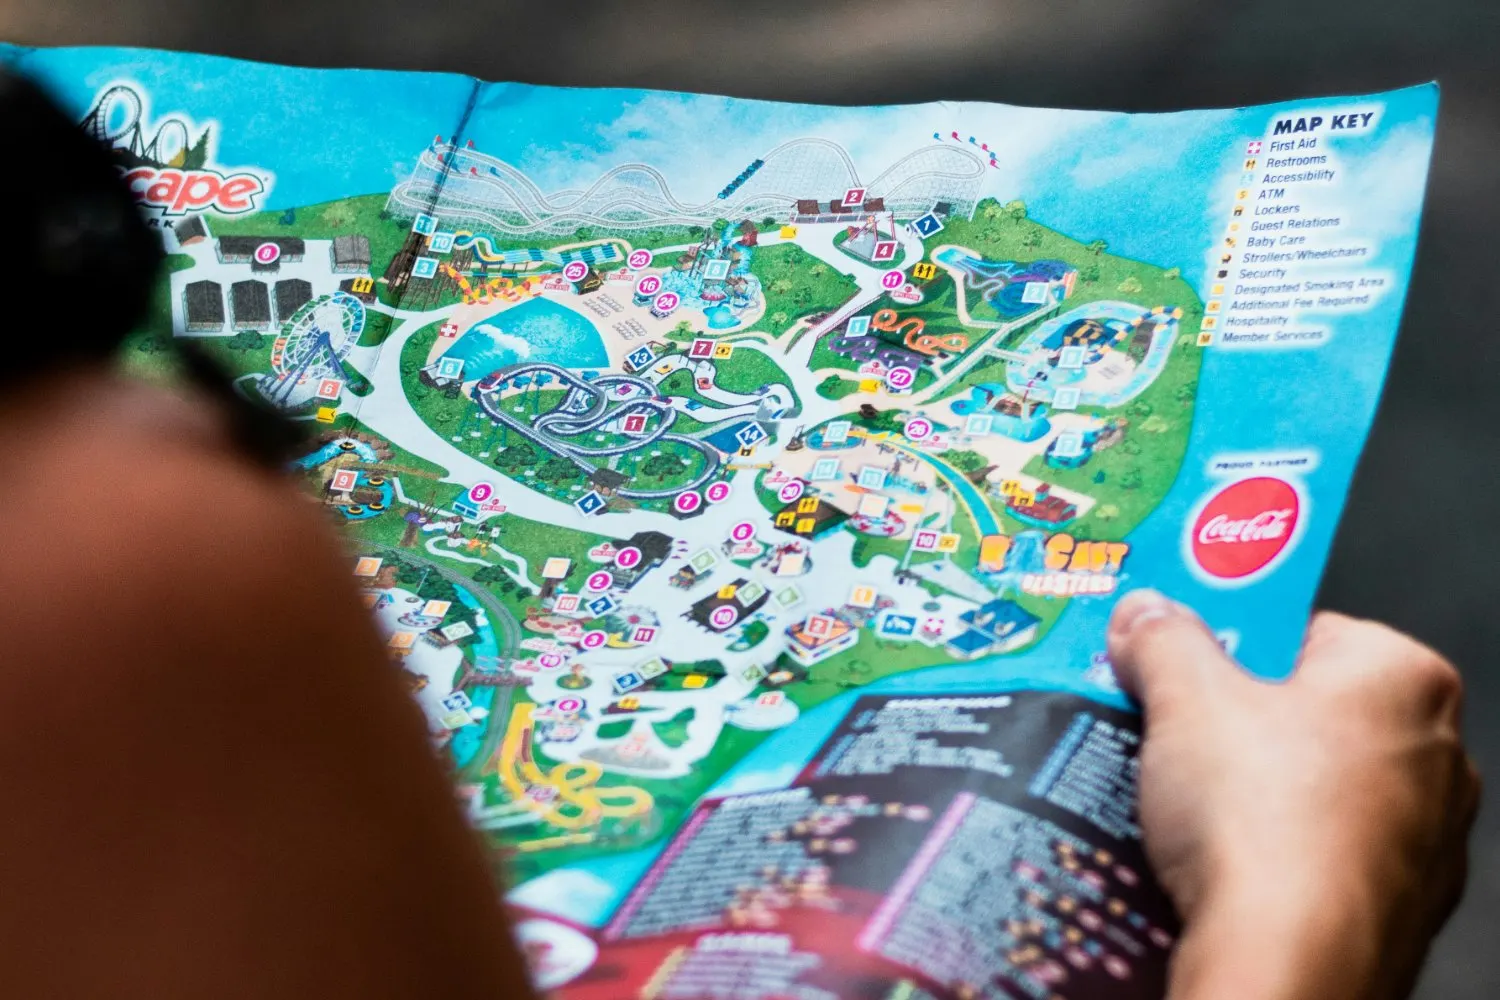
You arrive at a beautiful garden, sprawling resort or world-famous attraction. Someone hands you a colourful, folded paper map. It looks wonderful. Carefully illustrated buildings. Winding paths. Little numbered attractions. Perhaps a cartoon animal or two.
You unfold it, rotate it, attempt to work out where you are, and then try to match a tiny illustration to the enormous physical world around you. Eventually you find your bearings. Or you ask someone.
By the end of the visit, the map is crumpled in a pocket, forgotten in a bag or proudly taken home as a souvenir. There’s something rather lovely about that, don’t mistake us.
But here’s the question: is a souvenir really the best technology we have for navigating, experiencing and managing the places people visit?
We’ve turned one of the most important tools in the visitor experience into something people are more likely to keep than use.
A solution inherited from another century
The map was designed to represent a place. Then it became a way to sell one.
Maps have accompanied travellers for centuries. By the nineteenth century, they were doing something more than explaining geography: they were helping market destinations. Railway companies, hotels and travel businesses used illustrated maps to make places attractive and journeys appealing. An 1888 Union Pacific promotional tourist map is an early example of cartography being used as marketing.[1]
It’s an approach we still recognise today. Resorts accentuate their swimming pools. Theme parks make attractions tower over the landscape. Heritage sites simplify their grounds into picturesque illustrations.
There’s nothing inherently wrong with that. These maps were designed to communicate identity and inspire visitors. But over time, two fundamentally different jobs became intertwined: selling the experience and helping people navigate it.
What looks compelling on a brochure doesn’t necessarily make sense when you’re standing at an unfamiliar junction with three paths ahead of you.
A great marketing map doesn’t automatically make a great navigation tool.
From clay tablet to the blue dot
Two and a half thousand years of maps that explain, measure and sell places, then a single lifetime in which positioning, the web and the smartphone rewrote what a map can do.
- c. 600 BC Imago Mundi A Babylonian clay tablet, the oldest surviving map of the known world, places Babylon at its centre.
- c. AD 150 Ptolemy’s Geography Coordinates for some 8,000 places establish latitude and longitude as the grammar of mapmaking.
- 1477 The printed map Engraved plates make identical copies possible. The map becomes a product that can be reproduced at scale.
- 1569 Mercator’s projection Straight compass bearings on a flat sheet, at the cost of distorting size. Usefulness and faithfulness part company.
- 1675 Ogilby’s Britannia Ribbon-like strip maps follow the road rather than the landscape: navigation designed around the journey.
- 1740s–1820s Site plans Attractions such as Vauxhall Gardens use printed plans to explain their location and layout.
- 1791 The Ordnance Survey Britain begins measuring itself systematically. Precision becomes a national project.
- 1810s–1900s The map as marketing Hotels, resorts and railways turn maps into promotional media.
- 1890s–1960s Mass tourism Cycling, motoring and tourist maps distribute local knowledge at scale.
- 1933 Beck’s Underground diagram London’s Tube map trades geography for clarity, proving a map needn’t look like a place to be useful.
- 1950s The souvenir map Illustrated theme-park maps become keepsakes in their own right: beautiful, collectable and frozen in time.
- 1978–1995 GPS The first satellite launches in 1978; the system reaches full operational capability in 1995. Location becomes machine-readable.
- 2000 Accuracy for everyone Selective Availability is switched off and civilian GPS accuracy improves dramatically overnight.
- 2005 Web maps Google Maps makes maps interactive; APIs let businesses embed location into their own products.
- 2007+ The blue dot and 360° capture Smartphones put positioning in every pocket, and Street View lets people look around places remotely.
- 2010s–2020s Venue digital twins Indoor and venue maps merge mapping, points of interest, routing, 3D, mobile and live data.
The first problem: where am I?
Most traditional maps answer the wrong question.
A paper map is still surprisingly good at telling you where things are. It’s much less effective at telling you where you are.
To use one, visitors must establish their position, orient the map, interpret its scale, recognise limited landmarks and work out a route. That’s a considerable amount of mental effort for what should be a simple task.
- 5
- mental tasks before a visitor can take a single step with a paper map
- 1
- task with a location-aware experience: follow the route from where you already are
And the challenge grows with the environment: a 200-acre garden, multi-building university campus, large resort or crowded event isn’t necessarily straightforward to translate from paper to reality.
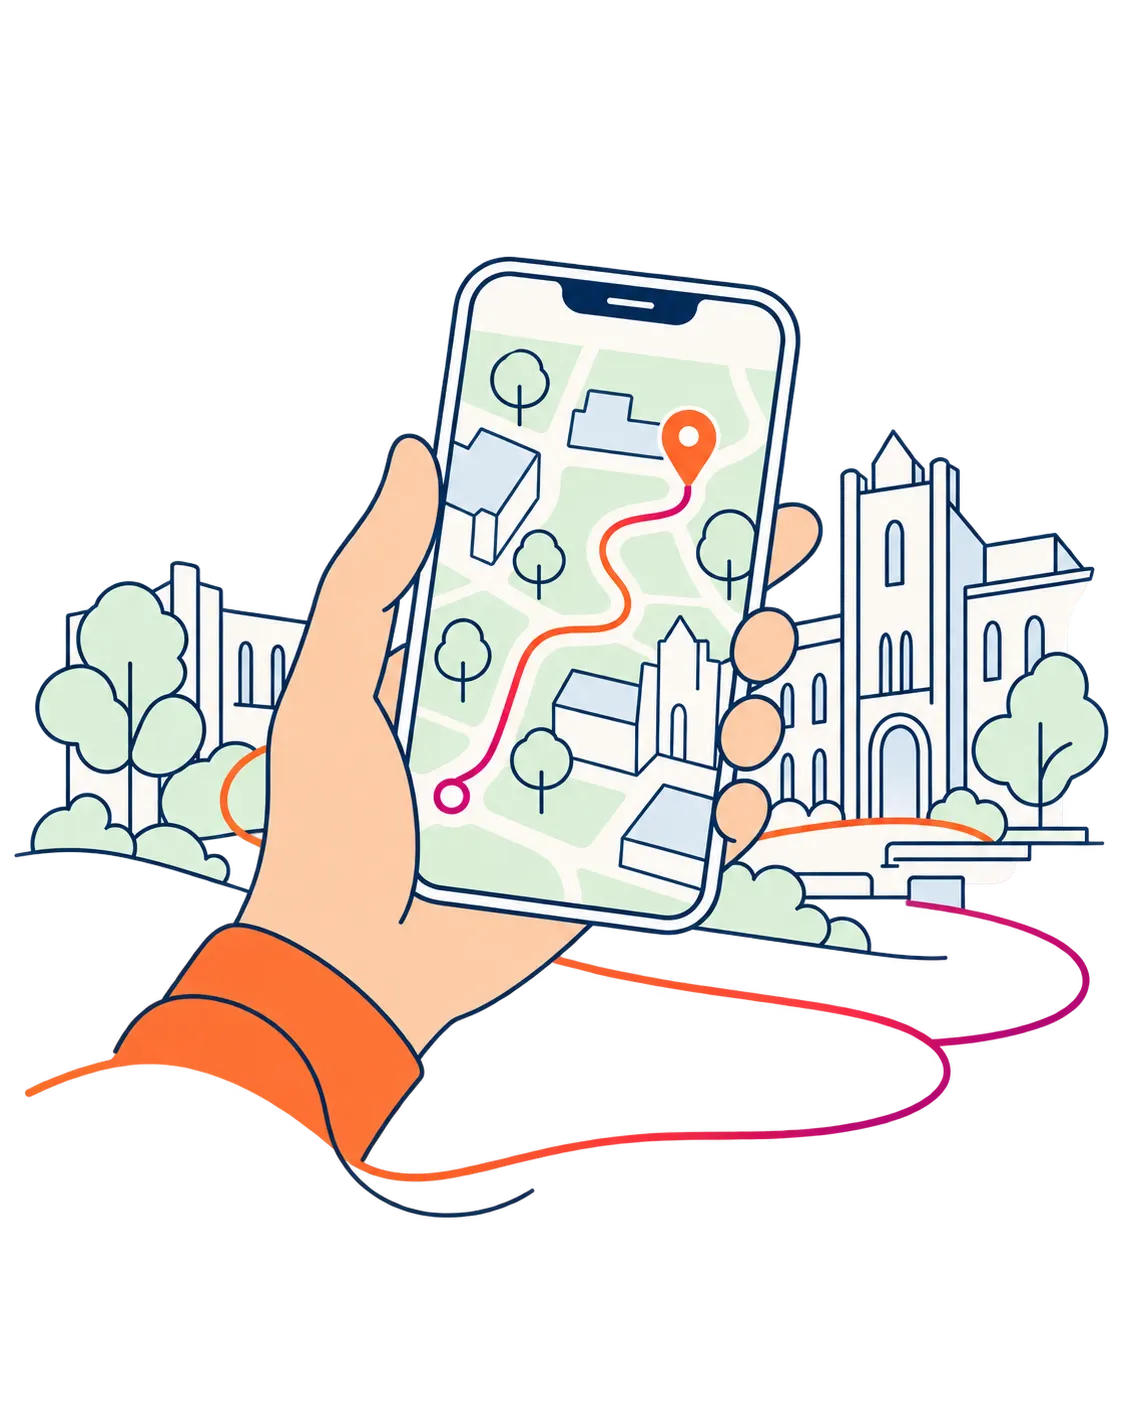
A location-aware experience can remove much of that friction. It can establish a visitor’s position where positioning technology is sufficiently accurate, relate it to recognisable surroundings, and provide directions towards their next destination.
The difference is subtle but important. One asks the visitor to interpret information. The other helps them act on it.
Knowing where everything is means very little if you don’t know where you are.
When the map looks nothing like the place
We have confused visual appeal with visual understanding.
Many attraction maps are beautifully stylised. Buildings are enlarged. Paths are straightened. Distances are compressed. Perspectives are distorted to fit everything onto a single page.
The result may be visually charming, but it creates another challenge: visitors must mentally translate the picture back into the physical environment.
Authenticity offers an alternative. An accurate visual representation of the real environment, supported by recognisable landmarks, can make it easier for people to relate what they’re seeing on screen to what they’re seeing around them.
Research published in Spatial Cognition & Computation in 2024 found that realistic landmark visualisations helped some people with lower spatial ability develop better directional knowledge. That doesn’t mean realistic 3D always beats simplified maps; it shows the potential value of making landmarks recognisable.[2]
The answer isn’t photorealism at any cost. It’s the right degree of fidelity for the task, combined with clear, accessible navigation.
The more a map looks like a fantasy, the more work the visitor may have to do to understand reality.
Sources
- 1. Cornell University Library: Union Pacific promotional tourist map (1888) https://digital.library.cornell.edu/catalog/ss:22374934
- 2. Kapaj et al., Spatial Cognition & Computation (2024): landmark visualisation and navigation https://doi.org/10.1080/13875868.2024.2328099
Navigation is only the visible problem. In part 2, we follow the money and the materials: what a piece of paper really costs, and what happened when three destinations made the switch.
- Part 1Beautifully folded. Fundamentally limited.Reading now
- Part 2The hidden cost of a piece of paperComing soon
- Part 3The future of maps may not be maps at allComing soon